


Let’s Talk KPI Basics (Key Performance Indicators)
September 4, 2018 | Grow Your Business | No Comments

There is much discussion of key performance indicators: what are KPIs? How to set KPIs? How to organize your dashboard? Let’s clear up some of the confusion as to what KPI means as well as discuss how to choose YOUR key performance indicators for YOUR dashboard
Key Performance Indicators, or KPIs, are a powerful tool to motivate and measure success. Typically, KPIs are used in business as benchmarks. But the concept of KPIs can be confusing and vague. Today we’ll clear up the confusion and discuss what separates the good KPIs from the bad and the ugly.
Let’s start with a definition of Key Performance Indicators: KPIs measure performance success against a goal. Success is typically defined as the achievement of a specific long-term goal, or simply the repetition of a period’s achievement of an operational goal.
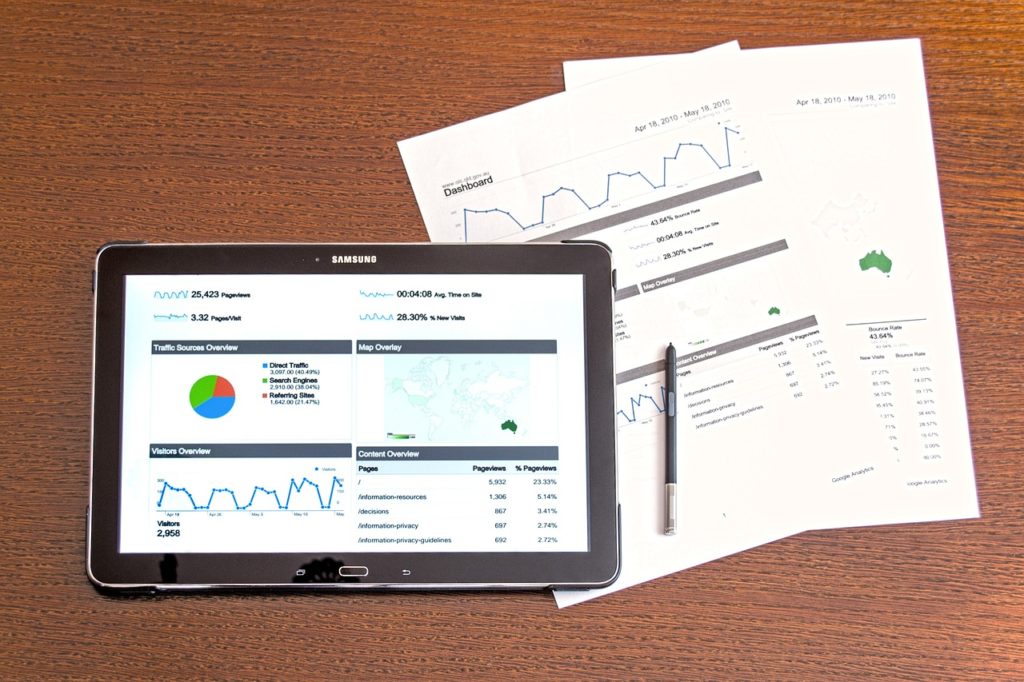
So, choosing the KPI that best represents the desired objective requires a deep knowledge of the business and the objectives. A quick report of the status of KPIs is called a dashboard.
Often, dashboards use short-cut visuals to hone in on performance. For example, in a typical dashboard, red might represent a KPI behind by at least 10%; yellow, one falling behind, and green meaning KPI is on/above the target. In sales, individual goal achievement might be visually represented by racehorses (or another icon) staggered, based on the percentage of goal achieved or sales dollars produced.
What Are Good KPI Examples?
Common attributes of a good KPI include:
- Well-defined, measurable information that is readily available or can be cost-effectively obtained,
- The KPI measures a factor that has a direct impact on a specific goal or long-term performance,
- The KPI is effectively communicated throughout the company, cascaded to responsible departments, and
- You can act on the indicator, holding team members accountable, when performance digresses from the goal
Measure KPIs in context and by that, I mean: define “compared to what?” If the KPI supports a strategic objective or specific goal, how does the KPI compare to that goal? For example, an internal goal of maintaining all accounts receivable under 90 days would then compare the receivables over 90 aging to the goal. Or, if the goal is to increase sales by 10%, then the monthly goals of calls, quotes, and orders expected as compared actual performance would be reflected on the dashboard.
Defining Good Key Performance Indicators
A recent visit I had with the commercial lenders at a local bank underscored the same dilemma I faced when I was running a business. What is a good KPI? With limited resources, how do I identify and track the best KPIs?
In my opinion, every company should track basic metrics:
- Margin (preferably by product line or in construction, by job) is sales less related costs of goods sold. Measure margin against an industry standard, historical performance or other similar benchmarks. Trends or performance against the industry metrics may indicate pricing or performance issues which need to be addressed.
- Pipeline means the sales you expect to close. Typically, measure the pipeline against history using the sales funnel (the percentage of quotes that convert to orders). Trends in the pipeline foreshadow future sales.
- Backlog indicates how many incomplete orders you have now compared to your normal level of outstanding orders. This trend may show future customer discontent or a slowing/improving of your sales.
- Lead Time is defined as how long it takes to get the customer the product from the time of the order. Compare to historical levels, industry standards, and competitor information.
- Financial Performance & Ratios Include a series of pertinent financial data and ratios as part of the financial review process. Simply adding a couple of formulas to the monthly financials provides the information. These indicators fall into categories of liquidity, activity, leverage, operating and asset productivity. Measured against industry and historical standards, trends are often the harbingers of what’s to come.
As you establish the Key Performance Indicators, keep in mind when measuring departmental or any other performance, the company must still function as a whole.

Incentives and performance integrate across the entire company. If the warehouse manager’s KPI to increase inventory turns results in production shutdowns due to lack of materials, you created what’s called a perverse incentive. This could also indicate your warehouse manager is very bad at the job or the tools aren’t in place to manage the inventory properly. In all cases, the KPI gives you an area to address – the incentive; the inventory management; the tools available to measure and manage; and possibly a production issue.
How to Select KPIs for Your Business
KPIs come in all sizes and types and there are hundreds, perhaps thousands of them. How to choose?
Guide your decision by keeping in mind: the availability of data, team member workload, internal dependencies and costs to help focus on the most important tasks at hand. Depending on what fits best with your business, there are several approaches:
- Simply start with the Company KPI measurements described above to get your feet wet on data collection, reporting, accountability, and response.
- Select what you believe is your biggest performance issue and look at what drives it. For example, if you decide revenues are too low or falling, contributing factors could be the volume of sales, pricing of sales, ticket size, lack of upselling/cross-selling, customer selection, number of SKUs, the conversion rate of quotes, number of sales calls…and the list goes on. Since you know your business intimately, you can probably select the top one or two items that might move your revenue number, such as, revenue generated by day per construction worker as a benchmark. Decide on and set the realistic goal (historical company information is useful, if available) – another not-so-easy task. Once the goal is set, assign responsibility and start measuring the driver against the goal.
- Get your CFO or Controller to analyze existing data over time. This data may include trends in margins, revenue per person, or other readily available financial measures to help identify any negative trends. Then select what you believe is the most impactful – similar to above– and address it.
- If you have an annual plan and/or budget, break down the objectives in the plan into daily, weekly, or monthly goals cascading into the departments that contribute to the success of hitting the target objectives.
Establishing a KPI Dashboard

After selecting your KPIs, consolidate them into a dashboard. A dashboard sounds complicated, but it’s simply the place where you put the KPI objectives along with the actual performance. This may be tracked in a physical location or tracked as part of a shared software program used by everyone in the company.
Each level of the organization that has accountability will have a different dashboard with the highest consolidation at the Company level. For example, the sales department will have a dashboard possibly detailing performance by the individual, whereas management will have sales at a summary level that evaluates all of sales performance against the total objectives.
At any time, your dashboard should give you a full picture of where the company stands and where each department is performing based on their goals. The dashboard changes in real time, with regular updates to track performance. It’s important to delegate and assign the responsibility to department heads or other parties to ensure KPIs are regularly monitored, tracked, and reported on the dashboard.
Establishing the RIGHT KPIs is no easy task. It’s important to adjust as you go and select indicators relevant to your company. If you’d like to learn more about KPIs, you can even become KPI certified.
While implementing a KPI system may seem intimidating, it’s best to simply pick an indicator or data point and start. Starting is daunting, but as you get used to the process and your data collection becomes more meaningful, you can refine your business measures. When done correctly KPIs are a powerful tool in your management arsenal and can help you succeed in setting greater goals for your company.
Featured image and all post images licensed for use via Pixabay.
